Browse by Solutions
Browse by Solutions
How do I generate report for sales pipeline in opportunities app?
Updated on December 27, 2019 12:57AM by Admin
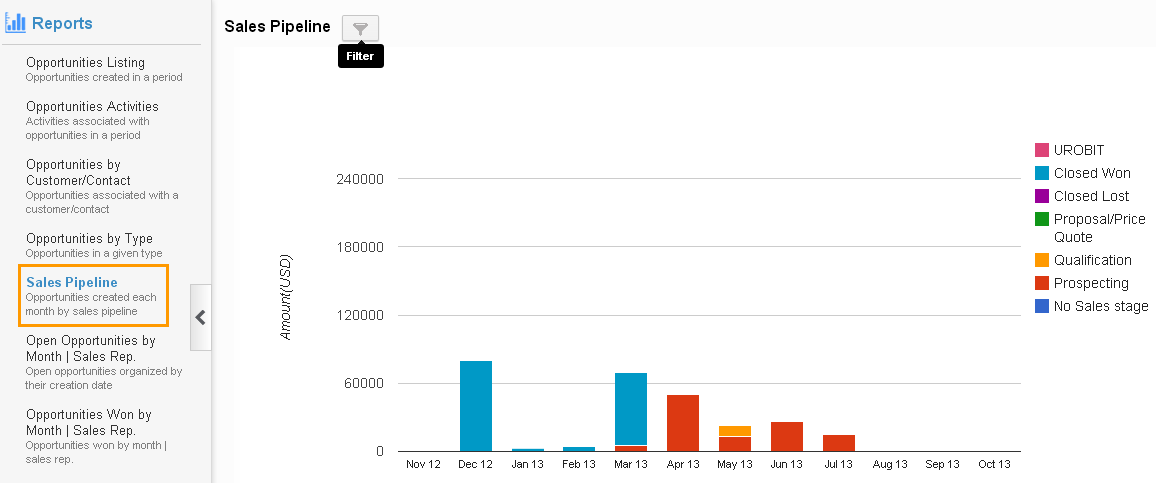
Monthly report of the opportunities in your sales pipeline will give the user an idea about how many deals that he have to close, how many he has already closed and how many he has lost. On analyzing the report he will get an idea of how to strategize the closure of the existing opportunities without losing them.
Opportunities App allows you to view the opportunities that are created in the sales pipeline each month using "Sales Pipeline" option. Let's go through the steps.
Steps to generate the report for sales pipeline
- Log in and access Opportunity app from your universal navigation menu bar.
- Click on “Reports” icon located at the app header bar.

- Click on “Sales Pipeline” from left navigation panel.

- Click on "Filter" option & provide the following information:
- Y axis – Value or count.
- Value - You can view Amount in Y axis.
- Count - You can view the Count in Y axis. (ie. Number of opportunities created for month)
- Sales Stage – Select sales stages such as Prospecting, Closed Won, Closed Lost etc.
- Start Date – Start date.
- End Date – End date.

- Y axis – Value or count.
- Click on "View Report" button to view sales pipeline reports in dashboard.
- Click on "Reset" button to cancel.
Related Links
Read more about:
- Generate list of lead source performance
- Generate list of sales forecast
- Generate list of opportunity stage performance
- Generate opportunity by customer
- Generate list of opportunities by lead source
- Generate list of opportunities by activity report
- Generate list of opportunities listing for a period
- Generate reports in opportunity
- Generate an estimates from opportunity
- Generate opportunities by type report
- Generate report for open opportunities by month
Flag Question
Please explain why you are flagging this content (spam, duplicate question, inappropriate language, etc):

