Browse by Solutions
Browse by Solutions
How do I generate report for opportunities by type?
Updated on November 12, 2017 08:55PM by Admin
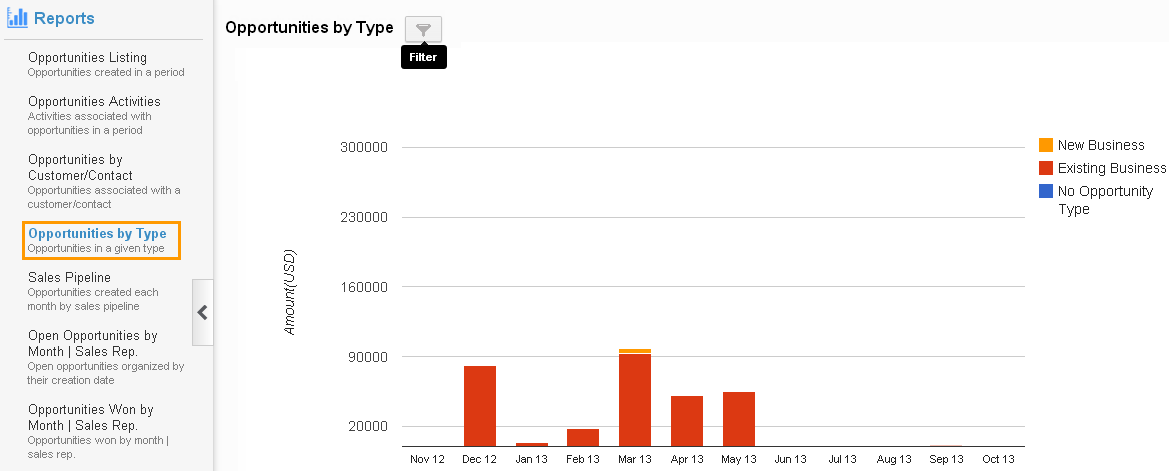
Opportunities app allows the user to filter the data to generate opportunity report using the functionality Opportunities by Type. This option is available on the left navigation panel of the application. The following steps will help you understand better..
Steps to generate report for opportunity by type
Steps to generate report for opportunity by type
- Log in and access Opportunities app from your universal navigation menu bar.
- Click on "Reports" icon located at the app header bar.

- Click on "Opportunities by Type" from left navigation panel.

- Click on "Filter" option & Provide the following information:
- Y axis – Value or count.
- Value - You can view Amount in Y axis.
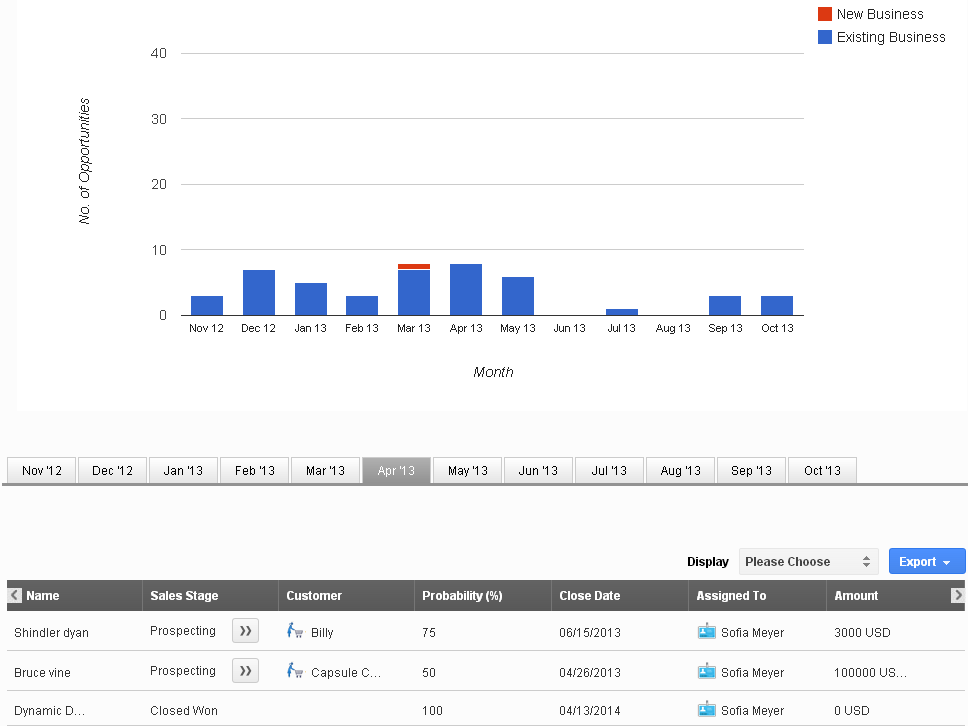
- Count - You can view the Count in Y axis. (ie. Number of opportunities created for month)
- Type – Select a type of business either existing or new business.
- Start Date – Start date.
- End Date – End date.

- Y axis – Value or count.
- Click on "View Report" button to view opportunity reports in a dashboard.

- Click on "Reset" button to cancel.
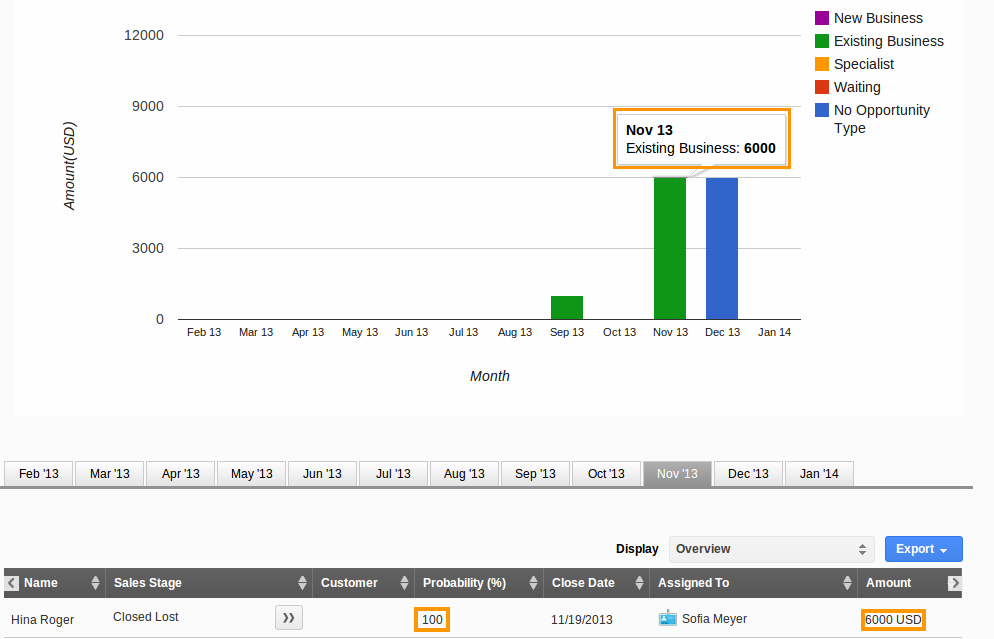
Why can't I view the bar in the chart, since I've given an enough value?
You can view the bar in the chart of respect months based on this formula probability * amount / 100.
For Instance: Here the probability is 100% and the amount is 6000 USD, then the result is "6000 USD" of "Existing Business" type.

Related Links
Read more about:
Flag Question
Please explain why you are flagging this content (spam, duplicate question, inappropriate language, etc):

