Browse by Solutions
Browse by Solutions
How do I view the Performance Dashboard in Campaigns App?
Updated on October 25, 2016 02:09AM by Admin
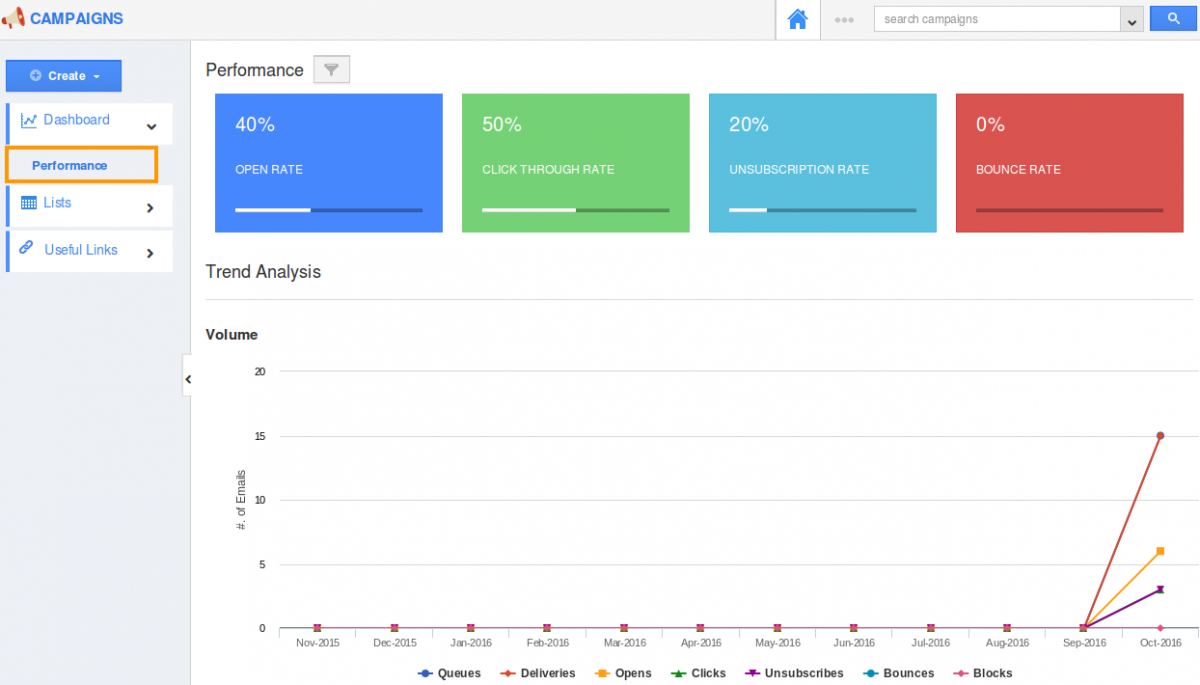
Email marketing dashboard is used to provide the in-depth view of the activities about the campaigns. Performance dashboards are pull data about the campaigns to view the trend analysis of your business targets. They provide a at-a-glance summary about the monthly performance of your campaigns activities.
Steps to View Performance Dashboard in Campaigns
- Login and access Campaigns App from universal navigation menu bar.
- Click on “Dashboard” and select “Performance” from left navigation panel.
- Open Rate - Total opens / Total delivered, based on the emails sent for campaigns.
- Click Through Rate - Total click through / Total delivered, based on the emails sent for campaigns.
- Unsub Rate - Total unsubscribed emails / Total delivered, based on the emails sent for campaigns.
- Bounce Rate - Total bounced emails / Total delivered, based on the emails sent for campaigns.

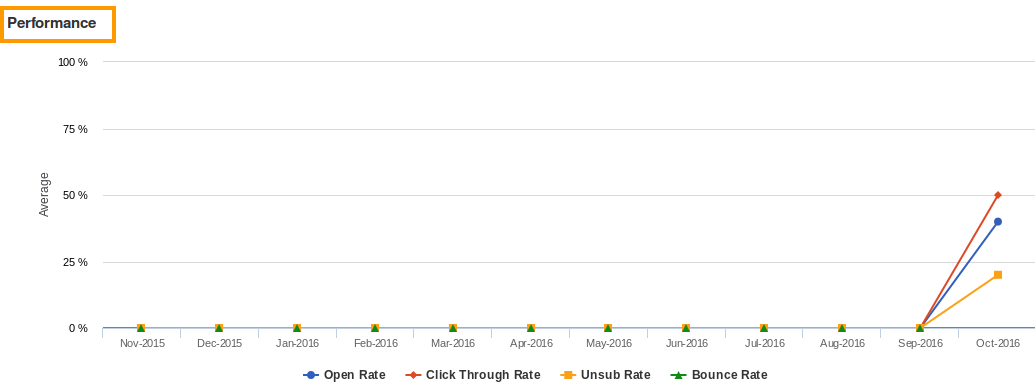
- Now you can view the dashboard with “Trend Analysis” and “Performance” graph of your campaigns app.
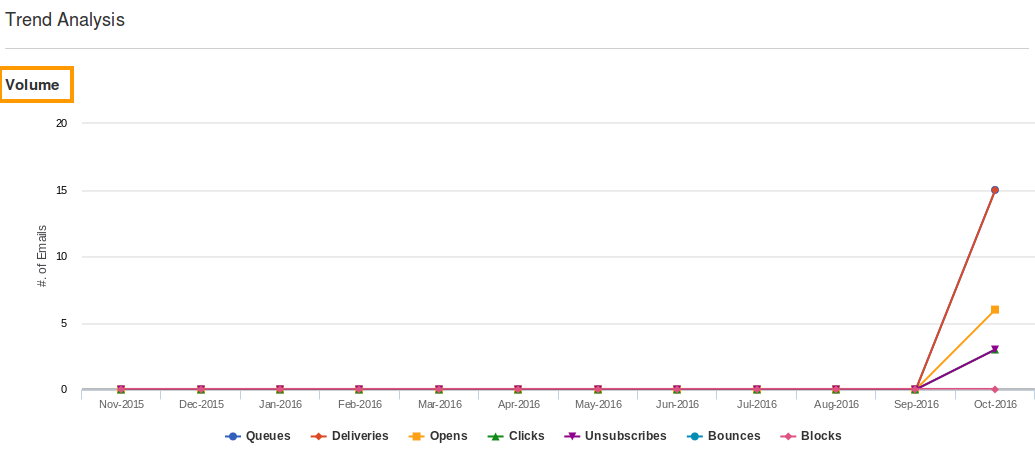
- Volume graph to shows the high level overview of the campaigns emails activities like number of delivered emails, clicked emails, Unsubscribed emails, Bounced emails, Blocked Emails.
- Queues - No.of emails on the queue.
- Deliveries - No.of delivered emails sent for campaigns.
- Opens - No.of opened emails.
- Clicks - No.of clicked emails.
- Unsubscribes - No.of Unsubscribed emails sent for campaigns.
- Bounces - No.of bounced emails.
- Blocked - No.of Blocked emails sent for campaigns.

- Performance graph allows you to view the different activity rates with the date range that was selected on the prompt page.

Related Links
Flag Question
Please explain why you are flagging this content (spam, duplicate question, inappropriate language, etc):

