Browse by Solutions
Browse by Solutions
How to configure the Matrix Table in Apptivo to effectively utilize quartiles for analyzing financial data within the sales pipeline?
Updated on February 14, 2024 10:07PM by Admin
In Apptivo's Intelligence Dashboard, the Matrix Table feature revolutionizes the analysis of financial data by introducing a dynamic tool tailored for sales pipeline evaluation. Central to this capability is the integration of quartiles, a statistical concept that divides a dataset into four equal segments.
The Matrix Table effectively combines two pivotal metrics: deal age and revenue potential, providing a comprehensive snapshot of the sales pipeline. Deal age is categorized into distinct stages - New, Stagnant, and At-risk, facilitating a nuanced understanding of the pipeline's dynamics.
Meanwhile, quartiles categorize deals based on their revenue potential, dividing them into three quartiles: Q1, Q2, and Q3. Each quartile signifies a specific range of revenue potential, with Q1 representing the lowest and Q3 indicating the highest. This segmentation enables sales teams to prioritize actions, pinpoint stagnant deals, and identify high-value opportunities within the pipeline.
By leveraging quartiles within the Matrix Table, sales teams can streamline decision-making processes, target resources effectively, and optimize pipeline health. Ultimately, this approach leads to enhanced conversion rates and increased revenue generation, empowering organizations to achieve their sales objectives with precision and efficiency.
Steps to Configure the Matrix Table:
- Log in and access the Opportunities App from your universal navigation menu.
- Navigate to Settings → Intelligence → Charts →App , From the Chart Page, Click the Create button and choose “Matrix Table”.
.png")
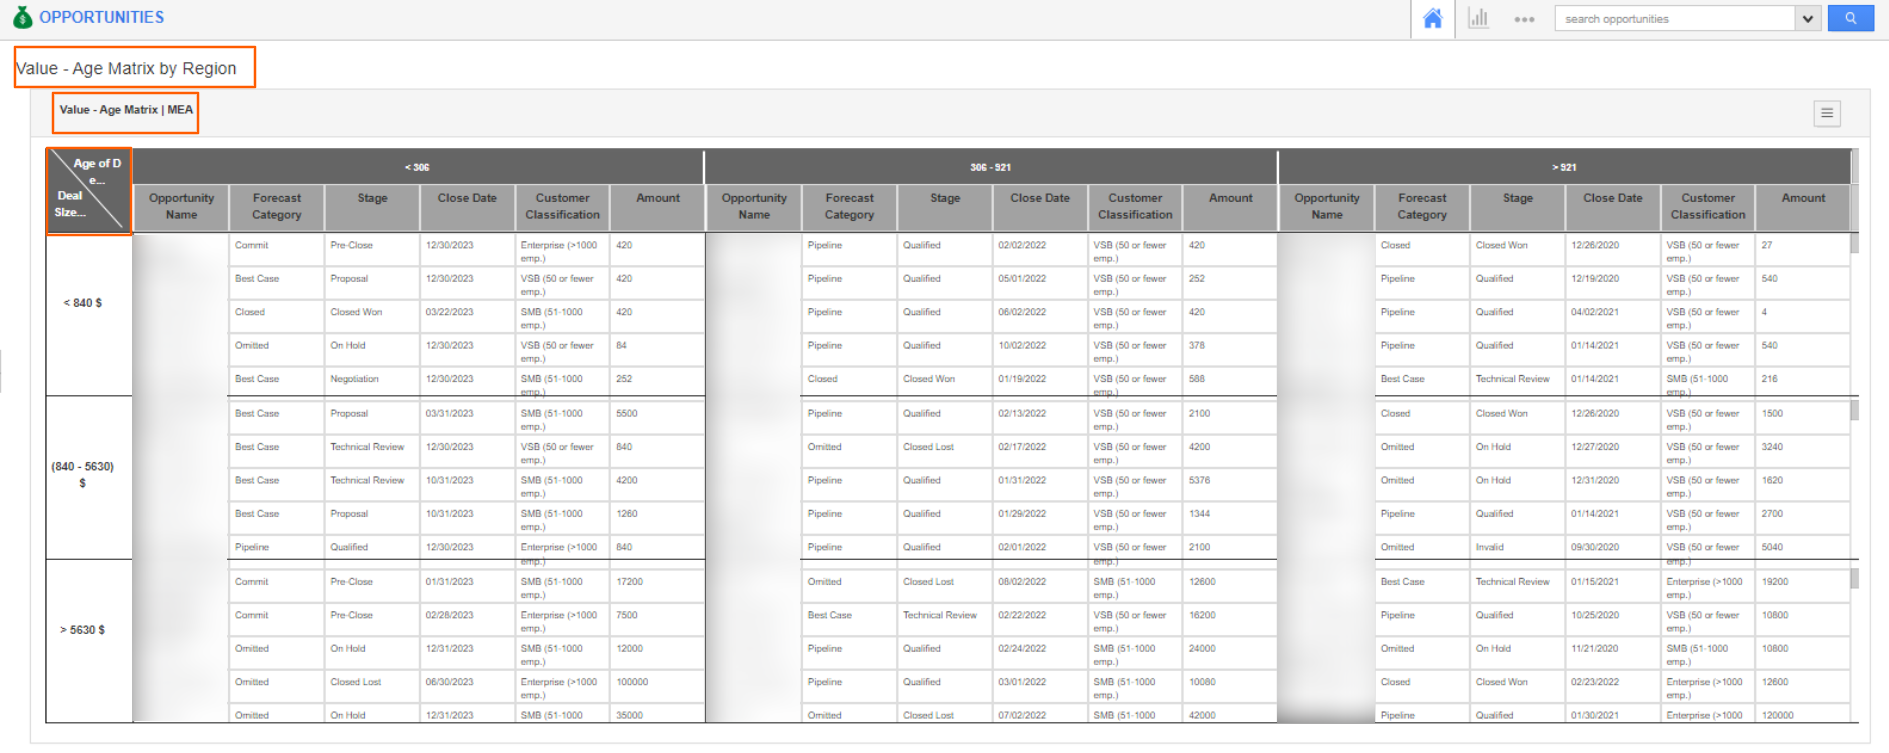
- Here, Enter the name for the Matrix Table, here it is titled “Value - Age Matrix | MEA".
- Provide access to the employees by clicking on the privilege dropdown menu, selecting the desired "privileges" from the list, and toggling the Enabled button to ON.
Note: Based on the Selected Privileges of the opportunities the employee will have access to the summary Table.

- By using the Inspector tab on the Right side, you can customize the matrix table as per your business needs.
- You can change the Table Title and the Default Rows of the matrix Table.

- The table is initially set up with 5 pre-configured rows, but you have the flexibility to adjust the number of rows according to your needs.
- The default row count is set as "5" here.
- Please note that a minimum of at least 1 row and a maximum of 10 rows can be added.
- If you attempt to input a value exceeding this limit, an alert will be displayed, notifying you that the "Maximum Row Limit Reached."
- Under the Context tab, you can configure the row and column attributes.
- Toggle ON the Value restriction to set the condition under the Filter tab.

- The quartile in the matrix table is calculated by filtering the data based on the value restriction. For example, if the criteria are set as "Region = MEA”, then only the records that meet this criterion will be used for the quartile calculation.

- Under the Context column tab, input the name to define the column's name.
- The default option for the Type dropdown menu is Quartiles.
- You can choose a specific attribute for your column by clicking the Attribute dropdown and selecting from the available options.
- In this case, the “Opportunity age (days)” attribute has been selected to categorize opportunities based on the deal period.

- Under the Value column tab, input the name to define the row's name.
- The default option for the Type dropdown menu is Quartiles.
- You can choose a specific attribute for your row by clicking the Attribute dropdown and selecting from the options.
- Here, the “Amount” attribute has been selected.
Note: To find the “Age of the Deal” in days, configure the Date Function formula to subtract the deal created on the date from the current date.
- Ensure you select the Layout attribute from the dropdown menu. Remember to choose a maximum of 6 attributes to avoid encountering an error pop-up message.
- Here, we have added the Opportunity Name, Forecast Category, Stage, Close Date, Customer classification, Amount on the Layout.

- Then, Click on the Filter Tab and enable the Filter Toggle.
- Add the Filter attributes as per your business requirement and then, click on the Create option.

- You can view the Created Matrix table on the list.

Steps to Add Matrix Table in Dashboard
- In the Settings page, click on the Intelligence → Dashboard → App and Click on the Create button.

- You will be redirected to the Create Dashboard page, add the name and description of the dashboard.

- From the palette tab, drag and drop a section onto the dashboard. Choose the "Matrix Table" from the Charts Section.


- Adjust the section name in the Inspector Tab to your preference. Then, click on the create.

- The new dashboard will be created and you can view the Created Dashboard in the List.

Steps to view the Matrix Table
- Now, go to the dashboards section in the Opportunities App.
- You can see the created dashboard - Value-Age Matrix Dashboard.

- In this Matrix table, the rows and columns are segmented based on specific attributes. The first column categorizes deals by their Age attribute into three quartiles.
- Similarly, the columns categorize opportunities by their "Amount" attribute into three quartiles.
- Within each segment of the matrix, the relevant opportunity records are categorized accordingly.
.png "Home-Add IP Address.png")
Note:Opportunities within the MEA region are populated in the matrix based on the configured value restrictions from the table.
- The "More" option above the matrix table allows users to export the table in both XLSX and .CSV formats, enhancing data accessibility and usability for our users.

- Here’s the preview of the exported sheet. You can view the exported sheets separately for each deal size and age below.


Note:
- This feature is supported in Ultimate and Enterprise plans.
- Admin can configure the charts based on the Plan usage count available in both app and business settings.
- Records will be displayed based on the roles and privileges assigned to users.
- Please note that this feature is not supported in mobile applications.