Steps to Create a Summary Table
- Login and access the Opportunities app from the universal menu.
- Click on the More(...) icon and select the Settings.
- In the Settings page, click on the Intelligence → Charts → App.
- From the Charts page, click on the Create and select the Summary Table.
- You will be redirected to the Create summary table page.
- Here, enter the name of the Summary Table.
Note: Based on the Selected Privileges of the opportunities the employee will have access to the summary Table.
- By using the Inspector tab on the Right side, you can customize the summary table as per your business need.
- You can change the Table Title and the Default Rows of the summary Table.
- Then, click on the Context tab to change the Coulum name and the values of the summary table.
- Here, the Summary table is for Opportunities so Opportunities Name Attribute is selected and the Titled the column as Opportunities Name.
- For the Value column, change the column name as Opportunities values.
- You can set the Aggregation value as Sum or Count and select the Opportunities Amount in the Attribute section.
- You can add the filter for the Table by enabling the Filter option.
- You can add another column by using the “+” icon.
- Then in the Formatting table, you can customize the format of the table.
- You can set the Sorting function as Ascending or Descending order for the Columns.
- You can also add the Highlighting by using the Add option in Highlighting.
- Then, Click on the Filter Tab, Enable the Filter Toggle.
- Add the Filter attributes. Here, Sales Stage, Leads source, Close Date, and the Type is added as the Filter Attributes.
- Then, click on the Create option.
- You can view the Created summary table on the list.
Steps to Add Summary Table in Dashboard
- In the Settings page, click on the Intelligence → Dashboard → App.
- Click on the Create button.
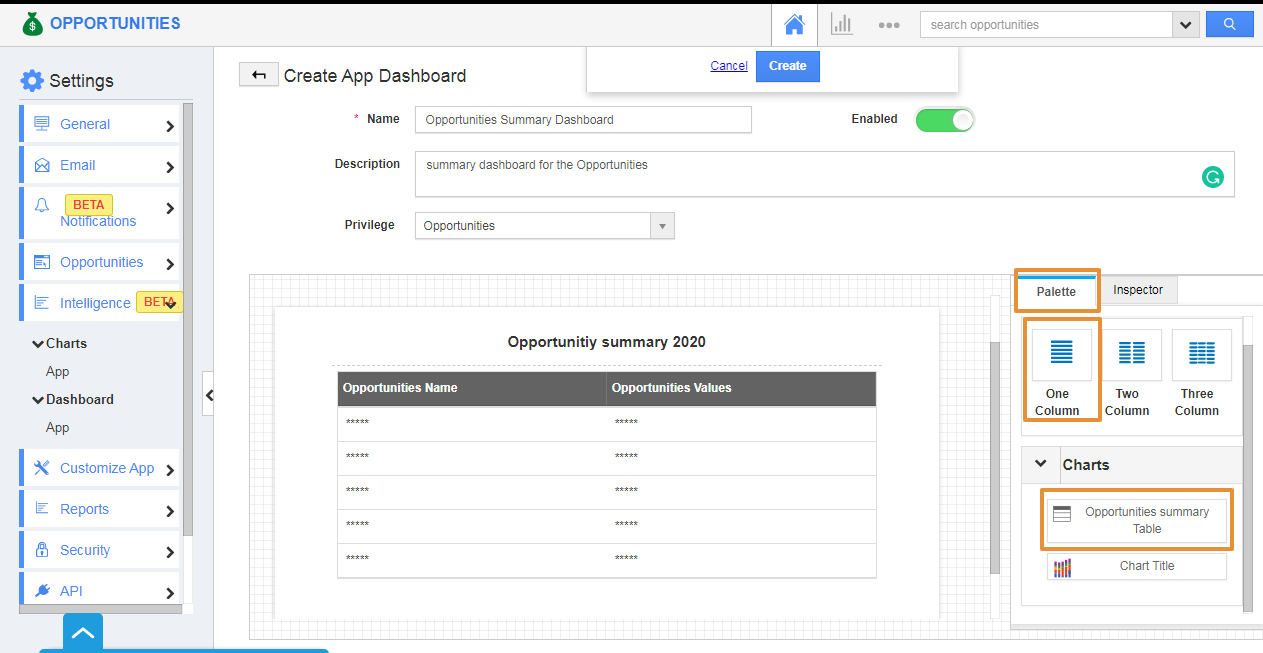
- You will be redirected to the Create Dashboard page, add the name, description of the dashboard.
- Using the drag, and drop a section from the palette tab and select the created summary table under the Charts Section.
- Change the Section name in the Inspector Tab.
- Then, click on the create.
- The new dashboard will be created and you can view the Created Dashboard in the List.
- Now, go to the dashboards section in Opportunities App.
- You can see the created dashboard - Opportunities Summary Dashboard.
- To filter out the records, you can click on the filter icon and determine the status based on which the record is to be filtered.


