Browse by Solutions
Browse by Solutions
How do I view sales pipeline from opportunities app?
Updated on November 28, 2017 09:58PM by Admin
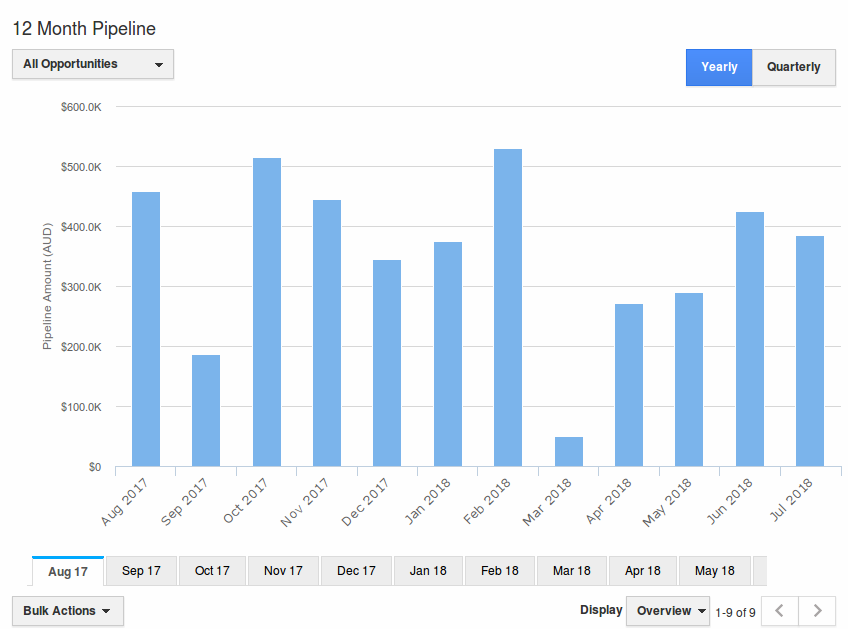
A sales pipeline consists of the total number of opportunities as well as the close date of each opportunity. The 12 months pipeline chart delivers the fundamental information of the opportunities that evaluates the amount with probability percentage.
The sales pipeline chart can be viewed in two ways:
- Yearly - This will display the potential amount of opportunities on the yearly basis.
- Quarterly - This will display the potential amount of opportunities on the quarterly basis.
Note: The Opportunities App calculates sales pipeline using this formula: (Amount * Probability / 100).
Steps to Create an Opportunity Pipeline Chart
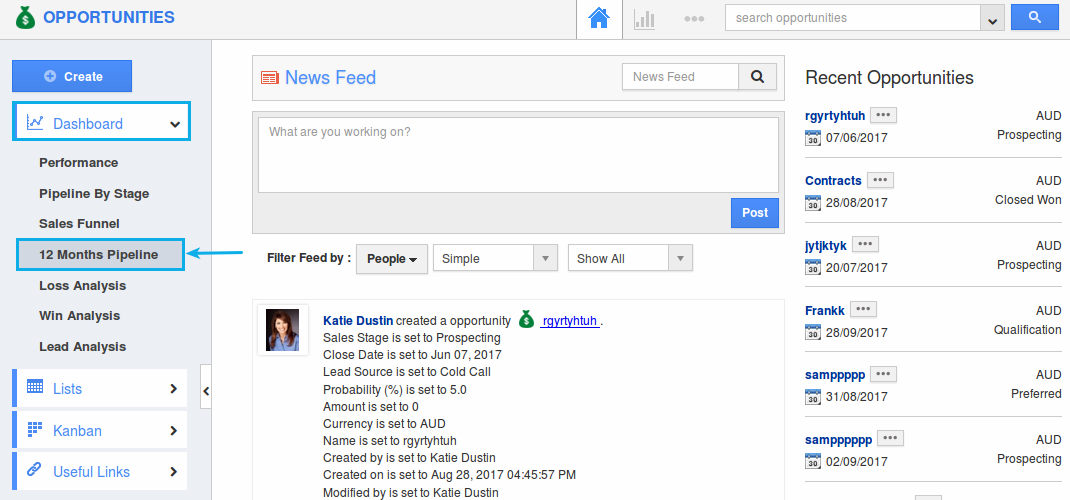
- Log in and access the Opportunities App from your universal navigation header bar.
- Click on the "12 Months Pipeline" in the "Dashboard" drop down from left navigation panel.

- You can view the sales pipeline chart as shown in the image below.
- By default, it will show the 12 month pipeline (yearly basis). It depends on the opportunities "Close Date".

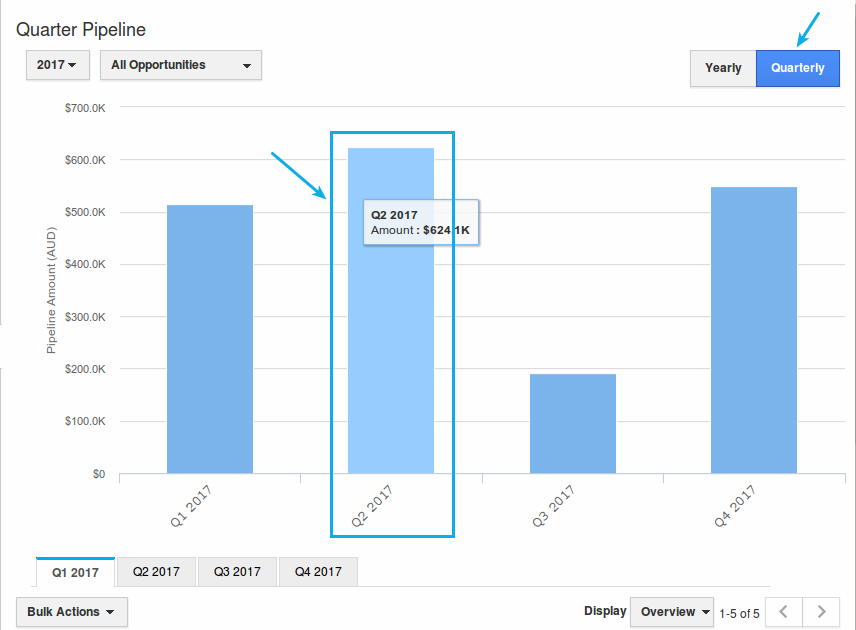
- Now to view the sales pipeline on the Quarterly basis, click on the “Quarterly” option found in the top right.
- The sales pipeline will be displayed based on the fiscal quarters as shown below:

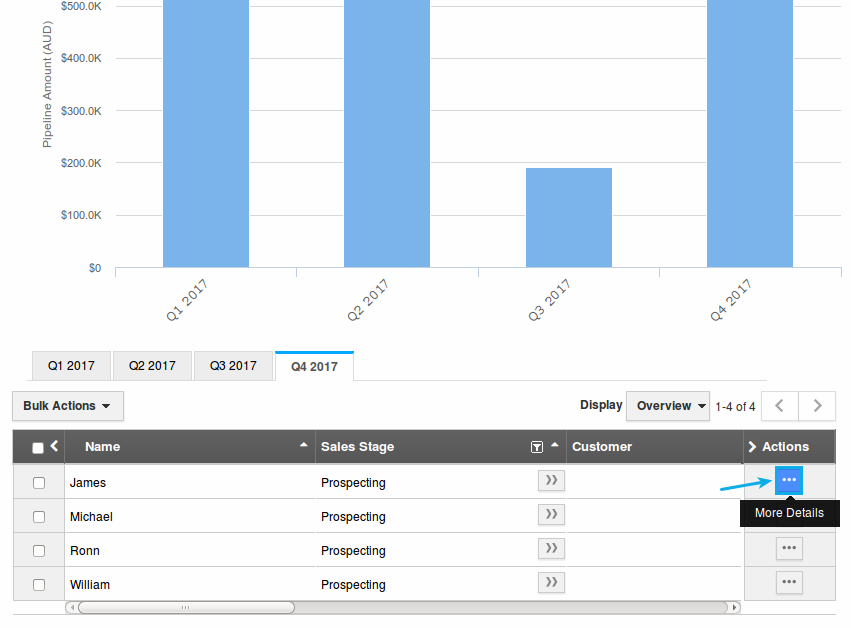
- Clicking on a particular quarter, you will be directed to the list of all opportunities having close dates in that quarter.
- From the dashboard, you can edit the opportunities accordingly by clicking on the “More Details (...)”.

Flag Question
Please explain why you are flagging this content (spam, duplicate question, inappropriate language, etc):

